April 30, 2009

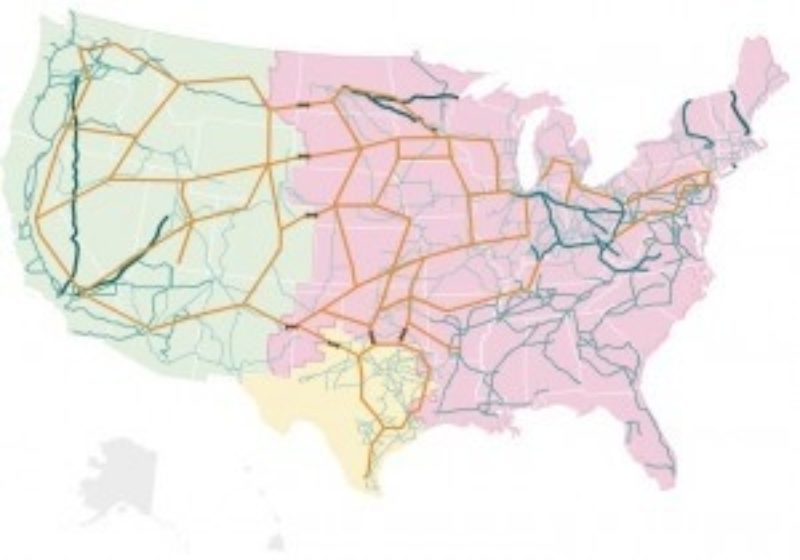
NPR has posted a great visualization of the US power grid. It shows the transmission grid, the mix of power sources in each state, locations of power stations and the densities of solar and wind power across the country. It makes the complexity of the power system and the challenge of replacing carbon based sources all too clear.